Interval analysis, transposition, and harmony using python
For python implementation, see notebook here.
See previous article for interval analysis and transposition (without harmony analysis).
A musical scale contains a set of notes, usually between 5 and 7 notes, spanning an octave. These notes are separated by intervals. An interval is the difference in pitch between two sounds. The interval between any pair of notes can be described in terms of the semitones separating them. For example, the pair (komal re, sa) [or (ri1, sa)] has an interval of 1 semitone, or minor second, which is the same interval as the pair (shuddh ni, sa) [or (ni3, sa)].
For the purposes of this analysis, we will ignore microtones and treat an interval as quantised; thus an interval of 85 cents can be considered 1 semitone. This way, the exact tuning/intonation of a scale is irrelevant. Any pitch class or svarasthāna differs from its adjacent pitch classes by 1 semitone.
For interval analysis, we only need a symbolic representation of the scale (or a melody); we don't need information about gamaka, fine-tuning of intonation, and musical context (such as ascent and descent).
Symbolic score. This depicts the sequence of notes coded as a list (or array) of numbers. We will define 0 to represent the tonic note, and all notes above and below it will be represented by the integer number of semitones separating that note from the tonic. Therefore, pa in the middle octave will be 7, and komal dha (or dha1) in the lower octave will be -4. For example, the sequence of notes in the ascending scale of bilāval/śankarābharaṇam is [0,2,4,5,7,9,11,12].
MIDI file. MIDI is short for Musical Instrument Digital Interface. Devices that make and control sound — such as synthesizers, samplers, controllers, and computers — communicate with each other using MIDI messages. We will create a MIDI file here that can be played using a MIDI player/synthesiser.
Symbolic score
For our analysis, we need to specify the notes in the scale. We will have to analyse the ascent and descent separately. Examples of scales:
ascent = np.asarray([0,4,5,7,9])
descent = np.asarray([0,4,5,7,9,10])
scale = np.asarray([0,1,4,5,7,8,11])
scale_2 = ["Sa","Re1","Ga2","Ma1","Pa","Dha1","Ni2"]
Visualising scales
One-hot encoded
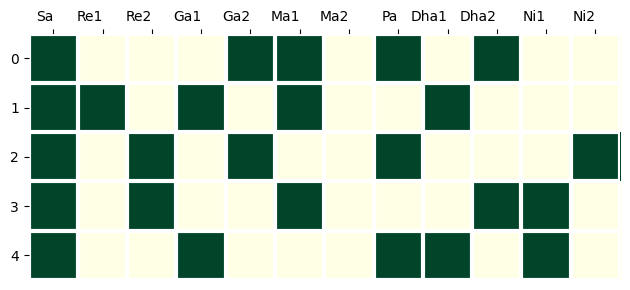
Here, the 12 notes in an octave are presented as 12 squares, together forming a rectangular strip of squares, and the notes present in a scale are highlighted. A set of scales is represented as a grid, each row containing 12 squares. Each row represents a scale, and each column represents a pitch class. We will be dealing with sets of related scales, so this visualisation will be useful. For example, a set of scales given by:
x = np.array([[ 0,  4,  5,  7,  9],
              [ 0,  1,  3,  5,  8],
              [ 0,  2,  4,  7,  11],
              [ 0,  2,  5,  9, 10],
              [ 0,  3,  7,  8, 10]]) # set of scales. Each row is a scale
can be visualised as:
Colour-coded
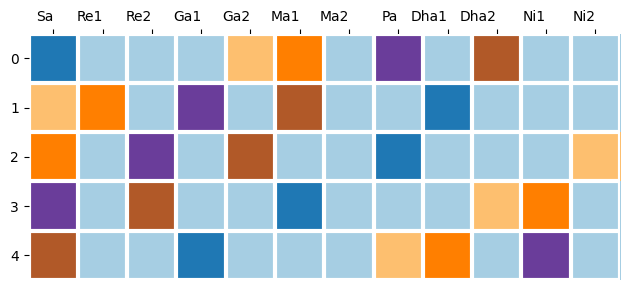
Assigning different colours to each note can help us better visualise how the scales are related to each other. The same set of notes as in the above grid can be visualised as a colour-coded grid:
Here, we can see that each note in a scale corresponds to some other note in each of the other scales. For example, the tonic (sa, position 0) in the top row (blue) becomes the minor third (komal ga/ ga2, position 3) in the bottom row (blue). All the scales in this set are transpositions of each other.
Interval matrix
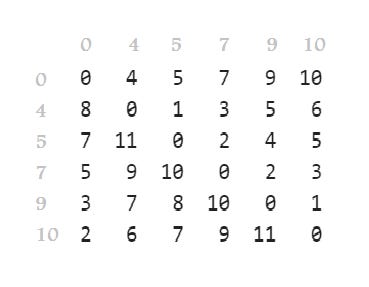
The interval matrix of a scale gives the intervals between all pairs of notes in a given scale. For example, if we take the following scale (sa, ga3, ma1, pa, dha2, ni2, sa):
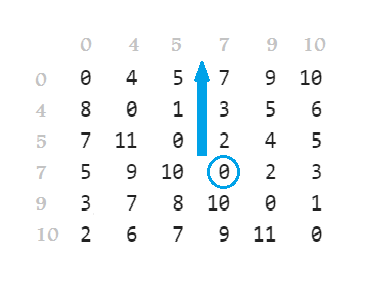
we obtain the following interval matrix:
Here, each number above the diagonal represents the distance between the row label and the column label (row and column label represent the respective pitch classes). The numbers below the diagonal also represent distances but the column pitch class is transposed one octave above.
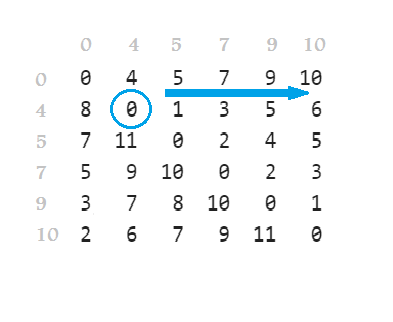
To see how far above a note is from another, locate the zero of first note and see the number curresponding to the second note's column. For example, if we want to see how far ma (5) is from ga (4), we locate the zero of 4 and read the number in the column titled '5'.
To see how far below a note is from another, locate the zero of the first note and see the number corresponding to the second note's row. For example, if we want to see how far ma (5) is from pa (7), we locate the zero of 7 and read the number in the row titled '5'.
Transposition/gṛhabheda
For this, we choose any note from the given scale as the new tonic, and interpret all the other notes (the same notes as in the original scale) relative to this new tonic. For example, starting with the same scale as in the above example, if we choose ma as our new tonic, then the original ga becomes ni.
We can approach transposition in two ways. One is to arrive at a different scale. A reinterpretation of all the notes of a given scale with respect to a new tonic yields a new scale. The other way is to stay in the same scale but hint at other scales by drawing parallels in the intervals.
Transposing the tonic
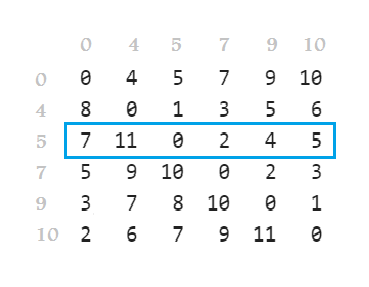
To transpose the tonic of a given scale, read along the row number to which you want to transpose. For example, for the same scale as in the above example [0,4,5,7,9,10], if we want to transpose the tonic to ma (5), just read the scale along that row, and the transposed scale would be [0,2,4,5,7,11].
We must manually check whether this new scale is practically feasible and whether it conforms to theoretical constraints. We can then use this new scale as it is or to inspire phrases in our original scale.
Harmony
Intervals relative to the root note
To find intervals relative to a note, read along the row number corresponding to the note that you want to set as the root. This is the same method used for transposition above. We can now pick all combinations of intervals from the available relative intervals to make up different kinds of chords.
After aligning the zeroes and adding the octave, we get the set of transposed scales that result from interval-preserving transposition of the given scale. We will use it to generate chords.
First, we will define all the chords that we want to consider for our analysis. For now, we will consider only simple triads and tetrads.
chord_list = {"major":[0,4,7],
              "major_7":[0,4,7,11],
              "dominant_7":[0,4,7,10],
              "minor":[0,3,7],
              "minor_7":[0,3,7,10],
              "augmented":[0,4,8],
              "augmented_major_7": [0,4,8,11],
              "augmented_7": [0,4,8,10],
              "diminished":[0,3,6],
              "diminished_major_7":[0,3,6,11],
              "diminished_7":[0,3,6,9],
              "sus_2":[0,2,7],
              "sus_4":[0,5,7]}
All intervals are defined relative to the root note.
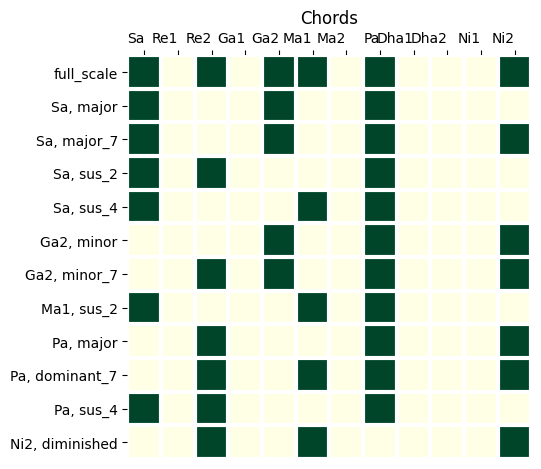
Using the 0-aligned matrix and the above dictionary of chords, we can find all chords starting with all root notes in a given scale.
Example
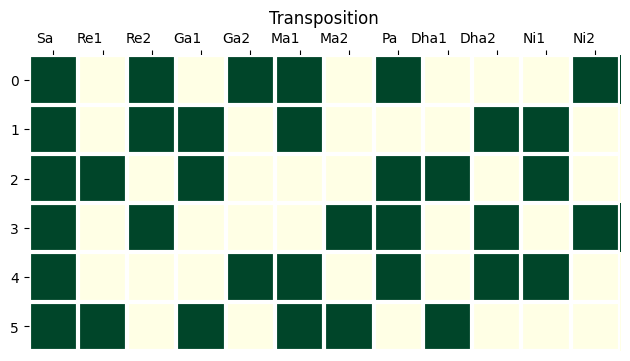
Here is an example of transposition analysis:
# example scale as input
scale_1 = [0,2,4,5,7,11]
Note that this visualisation doesn’t distinguish between different registers. For example, the major chord at Pa contains the notes Pa, Ni2, and RE2, but here, it is visualised as Pa, Ni2, and Re2. Only pitch classes are identified here. All possible inversions of a chord can be constructed from that information.
MIDI rendering of all the transposed scales (the code for this is not included in the linked notebook; see this other notebook for code):
MIDI rendering of the original scale and all the chords:


