In this series, ‘Waveforms to pitch contours’, we will look at various representations of sound and its features, from physical sound waves to digital recordings, spectral analysis of sound, and finally, visualisation of pitch contours in (monophonic) music.
Table of contents
Sound waves in air
Vibrating objects (such as strings, membranes, or really any vibrations) cause displacement in the surrounding air molecules, passing on some of the energy of these vibrations, which propagates through the air as sound waves. For example, here is how a simple vibration of a tuning fork produces sound:
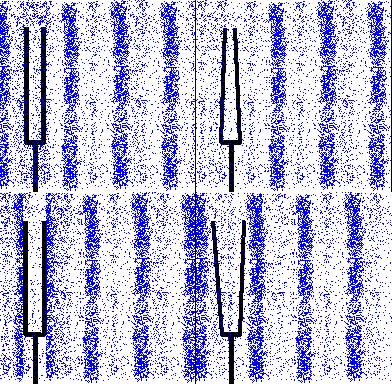
The sound waves consist of a series of compressions and rarefactions. Compressions have air density (or pressure) greater than the normal air density (or pressure), whereas rarefactions have a lower density (or pressure).

Perception of sound
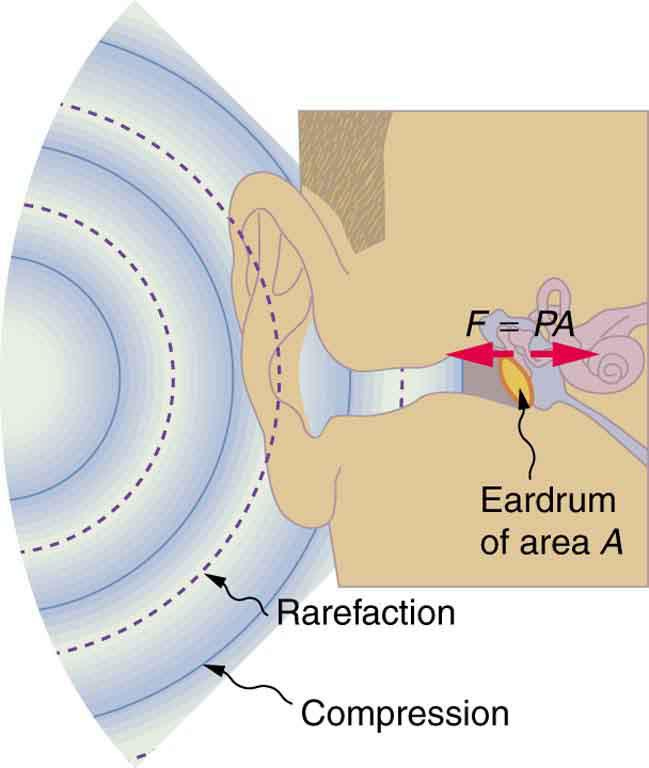
These sound waves reach our ears, which ‘analyse’ the sound waves and pass on that information to the brain, and that is where we perceive sound. The vibration of strings or the propagation of waves through the air itself is not sound. Sound is the subjective experience that happens in our brains. This subjective experience is facilitated by our ear. And the perception of sound is closely tied to the characteristics of sound waves that reach the ear, such as the amplitude, frequency, and other features of sound.
Characteristics of sound waves
Note that sound needs a medium to propagate; it cannot travel through vacuum. Also, sound always starts with a physical vibration — vibrating strings, vocal chords, and drum membranes; clapping of hands; rubbing of two surfaces.
AMPLITUDE
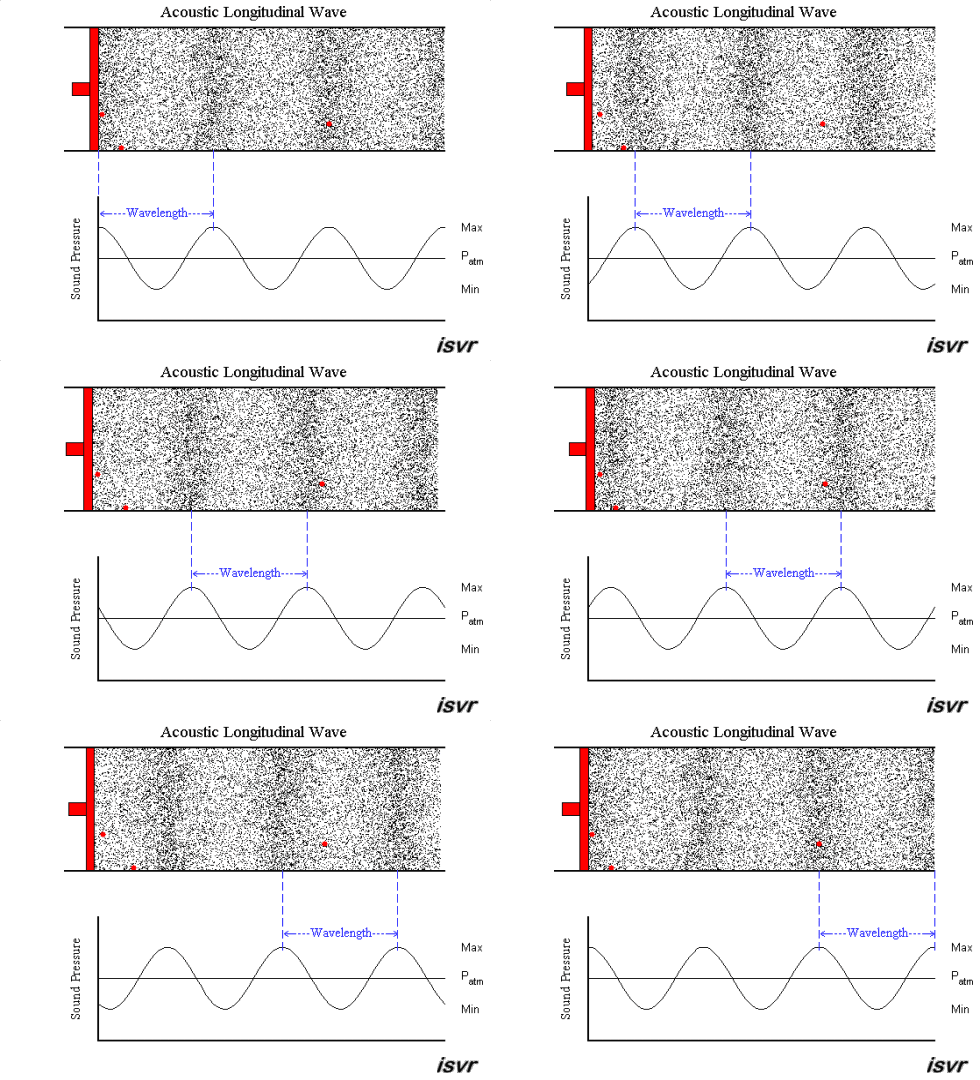
The degree of compression or rarefaction (measured in pressure units) relative to the normal atmospheric pressure is the amplitude of a sound wave. Amplitude of sound waves is related to loudness: sounds with high amplitude are perceived as louder.
WAVELENGTH
Wavelength of a sound wave is the distance between two consecutive compressions or rarefactions.
SPEED
Speed of a sound wave denotes how fast the wave moves from one point to another in space through a medium. Speed depends on the medium’s mechanical properties. Usually, speed of sound is greater in solids than in liquids than in gases. Speed of sound in air is 343 metres per second, but this varies with temperature and altitude.
FREQUENCY
Frequency of a wave indicates how many complete cycles (a cycle includes a compression and a rarefaction ) pass through a point in 1 second. Frequency is inversely proportional to wavelength.
Frequency of sound waves is related to pitch: high-frequency waves are perceived as having a high pitch, whereas low-frequency ones are perceived as having a low pitch.
A sinusoidal sound wave can be described in terms of its amplitude, wavelength (or frequency), and speed. Complex sound waves can be described as combinations of simple sinusoidal waves.
Microphones and speakers
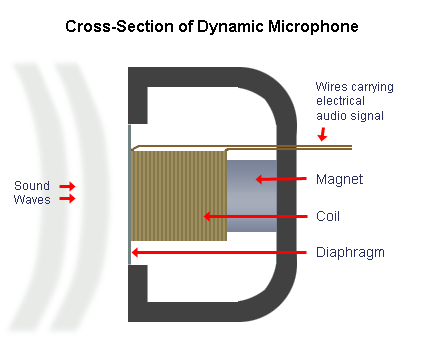
If we measure air pressure at a point through which a sound wave passes, we can get the waveform (graphical representation) of the sound wave. This is the process through which a microphone records sound. The sound signal (pressure variations in the air) is recorded as an electrical signal (variations in voltage/current) using a transducer (see figure below). The incoming sound waves cause vibrations in the diaphragm, which moves the coil forward and backward past the magnet, creating a current in the coil, which is usually amplified before further processing.
A/D conversion
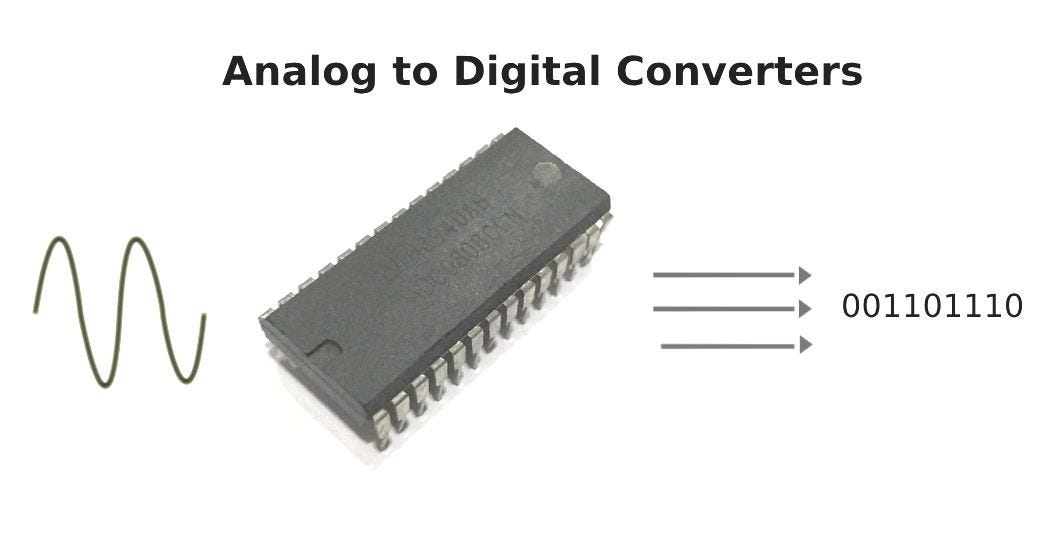
The output of a mic can be amplified and directed to a loudspeaker, which then converts the electrical signals back to sound signals using a similar process involving a moving block and a membrane. However, to save the audio for later use, the output of a mic is converted to a digital form using analog-to-digital (A/D) converters, which let us store the signal in a digital format, such as in a hard drive. This creates a digital representation of sound that contains all information we need to reproduce the sound.
Sampling and quantisation
Just like how a video camera captures a video as a series of pictures taken in quick succession (depending on the frame rate, usually about 24 fps), sound is captured as a series of air pressure measurements taken in quick succession, usually at a rate of about 44.1 kHz, or 44,100 samples per second. A higher sampling rate results in a more accurate representation of sound.
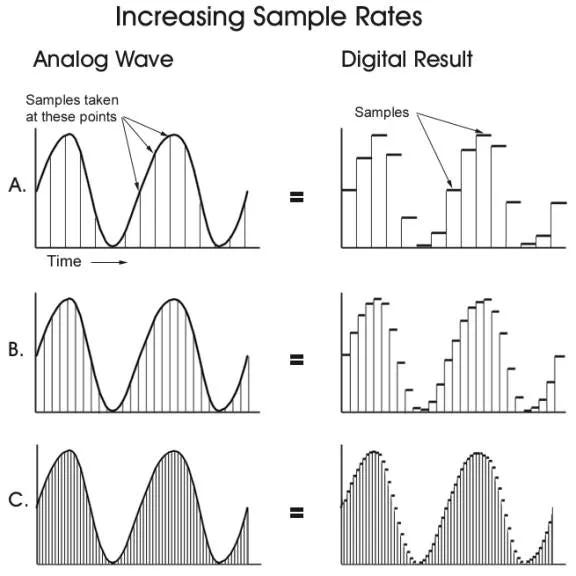
To avoid aliasing, a sampling rate of at least double the maximum frequency is required. That is, if we want to record sound with frequencies up to 20 kHz (which is the upper limit of human hearing), we need a sampling rate of at least 40 kHz. Alternatively, for a sampling rate of 40 kHz, the highest frequency that can be recorded without aliasing is 20 kHz. Thus, a signal sampled at a rate F can be fully reconstructed if it contains only frequency components below half that sampling frequency, F/2. This frequency (F/2) is known as the Nyquist frequency.
For digital audio, once the analog measurements are done, these are ‘rounded off’ to the nearest allowed value. This is because we can’t store numbers with arbitrary precision, as it takes infinite amount of memory to, say, store an irrational number with all its decimal values. This is why, the entire range of measurements is divided into a specified number of values, and each measurement is then saved as its nearest division. This is called quantisation of samples. The number of bits that each value can take is called the bit depth. For example, if the bit depth is 3, only 8 different values are possible (between 000 and 111 in binary), whereas a bit depth of 16 allows for 65,536 (or 2^16) values of amplitude. The most common audio bit depths are 16-, 32-, and 64-bit.
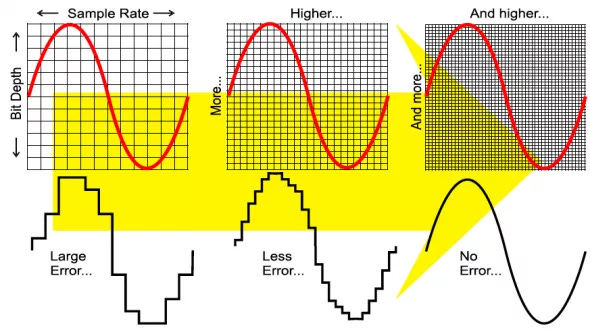
Quantisation introduces errors because we are representing a measurement with its closest possible value on the grid above. In digital audio, we hear this randomization as a low white noise, which we call the noise floor.
Below is an example of how an actual sound signal might look when measured. It contains two waveforms because the sound is measured at two different points in space; this gives us stereo sound, which can be played back using two speakers (one for each ear).
WAVE files
One of the simplest ways to store digital audio is in a file format called WAVE, which comes with the file extension .wav and saves the measured waveform as it is, without compression. This digital data can be saved and transferred electronically and can be played on a speaker by simply converting it back to analog signals using a sound card.
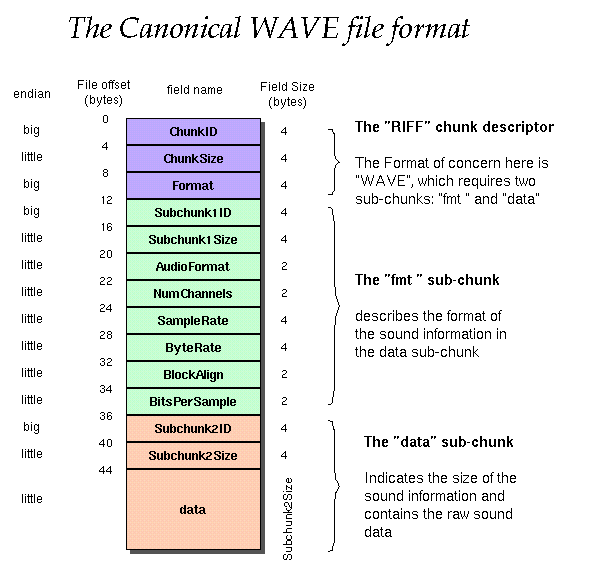
Other file formats such as MP3 (.mp3) store compressed data and are not suitable for audio analysis because the compression usually results in loss of information.
Time-domain features
AUDIO ENVELOPE
It is defined as the trajectory of the local (frame-wise) maxima of amplitude over short sections of audio. It gives a rough idea of loudness over the duration of the audio. To calculate the envelope, we first take a frame (a short section of audio) of predefined size, find the maximum value from all samples in the frame, take that as one point in the envelope, and move on to the next frame. This way, we get one point for each frame, which together give us the envelope.
Taking a frame size of K samples, the amplitude envelope AE_t at frame t is given by
where s(k) is the amplitude of kth sample.
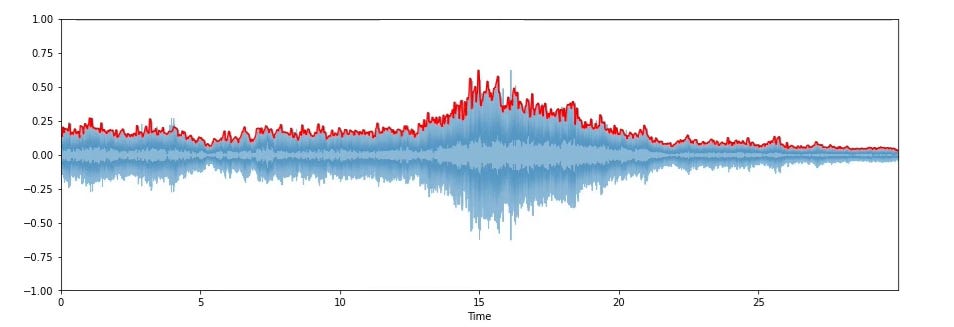
Envelope is sensitive to outliers and is used in applications such as onset detection and music genre classification.
RMS ENERGY
This too is calculated frame-wise, by calculating the root-mean-square energy of all samples in each frame. Taking a frame size of K samples, the RMS energy RMS_t of a frame t is given by
where s(k) is the amplitude of kth sample.
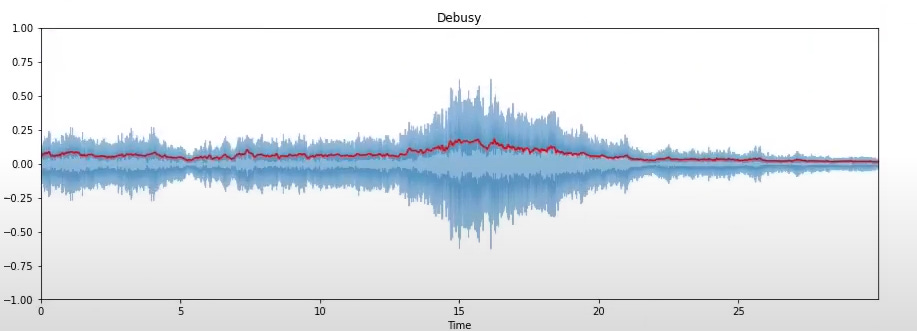
Like amplitude envelope, this RMS energy is also an indicator of loudness but is less sensitive to outliers than amplitude envelope. It is used in applications such as audio segmentation and music genre classification.
ZERO-CROSSING RATE
This indicates the number of times the signal crosses the horizontal axis. Over a frame of size K, the zero-crossing rate for frame t is given by
where where s(k) is the amplitude of kth sample, and sgn is a sign function:
Some applications of ZCR include speech recognition, recognition of percussive vs pitched sounds, monophonic pitch estimation, and recognition of voiced vs unvoiced consonants in speech signals.
In the next two articles in this series, we will look at spectrograms and frequency domain features of sound, pitch contours for monophonic music, and some applications of the same.


